Expelexia – AI Lab Notebook Assistant
AI-powered assistant for safe experimental reasoning
AI-powered assistant to help researchers safely analyze experiments, suggest next steps, and visualize results.
Sample Files in Project
Use these examples to quickly test upload, analysis, safety checks, dashboard, and report generation.
- 📄 IOT-temp.csv
- 📄 patient-notes.docx
- 📄 equipment-checklist.xlsx
- 📄 lab-microscope-image.jpg
Tools Flow
Core tools used in this project, flowing horizontally with logo motion.
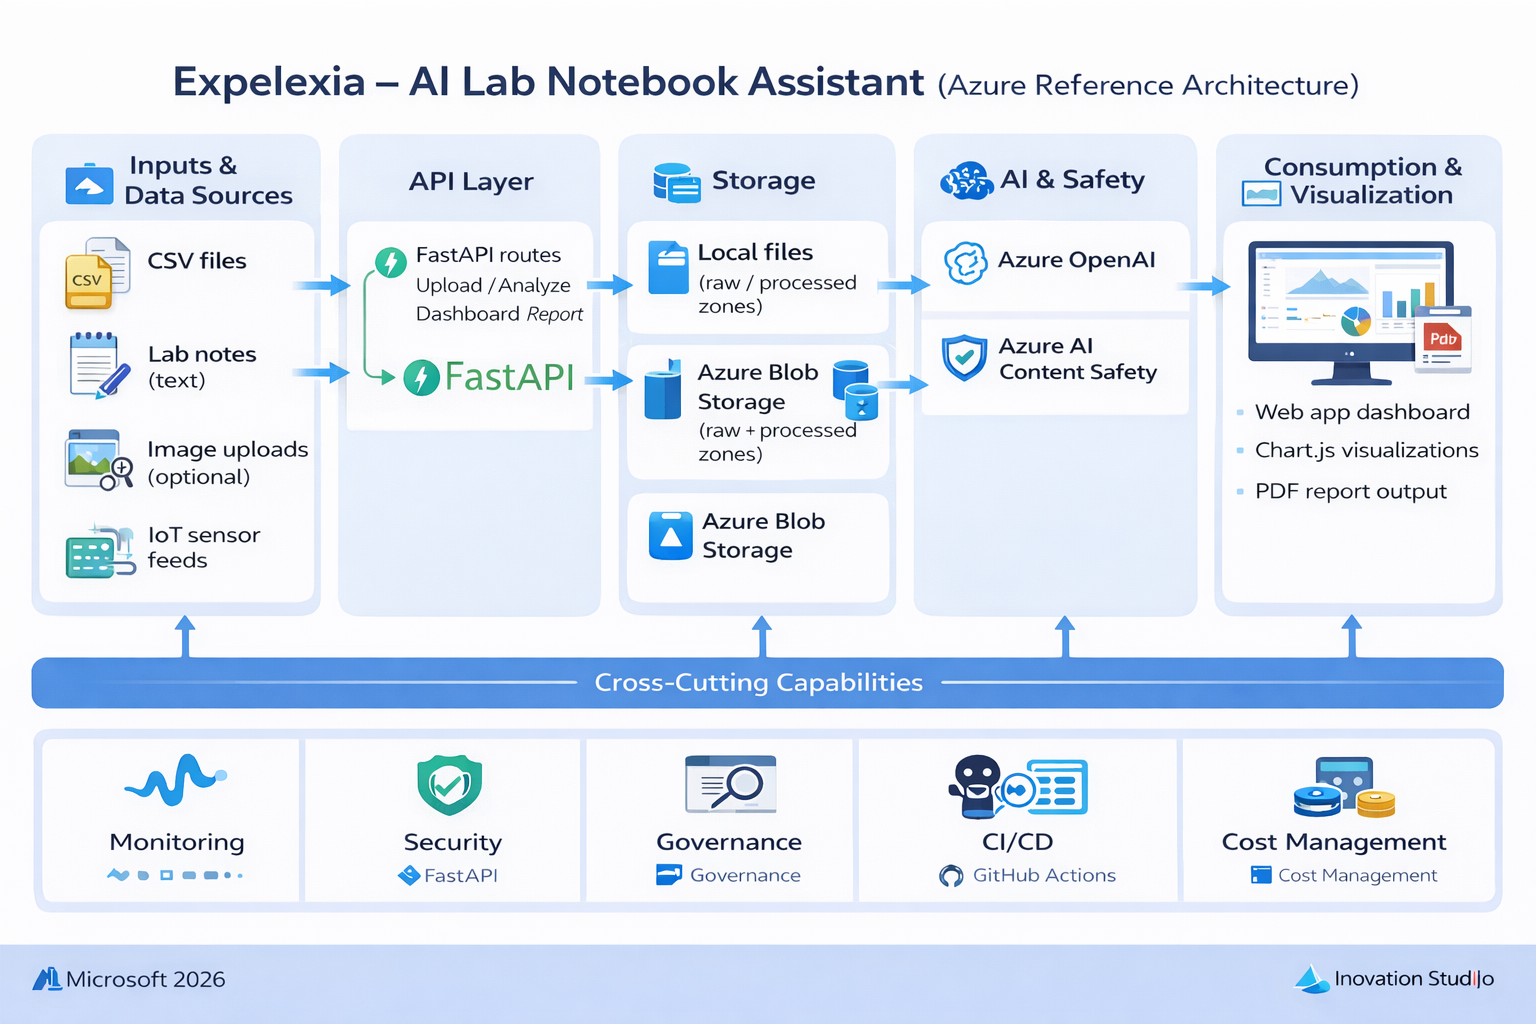
Azure Reference Architecture
Clean left-to-right data pipeline for Expelexia AI Lab Notebook Assistant.
Inputs & Data Sources
- • CSV files
- • Lab notes
- • Images
- • IoT feeds
API Layer
- • FastAPI routes
- • Upload / Analyze / Dashboard / Report APIs
Storage
- • Local files (raw/processed/reports)
- • Azure Blob Storage
AI & Safety
- • Azure OpenAI
- • Azure Cognitive Services
Consumption & Visualization
- • Web app dashboard
- • Chart.js visualizations
- • PDF report output
Cross-Cutting Capabilities
Expelexia AI Lab Notebook Architecture
Visual overview of how data flows from ingestion to AI-assisted recommendation and report delivery.
What this architecture shows
- • Data ingestion from experiment files, notes, images, and IoT streams.
- • Processing and summarization through secure remote backend services.
- • AI reasoning with Azure OpenAI and safety checks via Azure Cognitive Services.
- • Dashboard and PDF outputs for explainable lab decisions.
Why it matters
The architecture makes Expelexia production-oriented: each recommendation is tied to data evidence, routed through safety controls, and delivered in a format teams can audit, review, and act on.
Project Workflow
End-to-end plan to run Expelexia from raw inputs to trustworthy next-step guidance.
1. Load Experimental Data
Bring in experiment protocol text, CSV measurements, and optional image evidence.
2. Generate Next Steps
Connect AI reasoning to propose safe and practical next actions with confidence.
3. Visualize in Web Dashboard
Render metrics, trends, and anomaly views directly in the Expelexia web app.
4. Validate Safety & Explainability
Apply Content Safety and transparent reporting before sharing recommendations.
Web Dashboard in Expelexia
The decision layer is built into the web app itself. The remote backend generates chart-ready metrics and summary tables, and the frontend renders trends, anomaly views, and confidence context using Chart.js components.
This keeps explanations and visuals aligned in one place: AI suggests the next safe step, and the web dashboard displays the supporting evidence.
References
Data and implementation references used in this project.